Trump’s Reciprocal Tariff Strategy: Why the U.S. Charges Half What Others Do—The Math
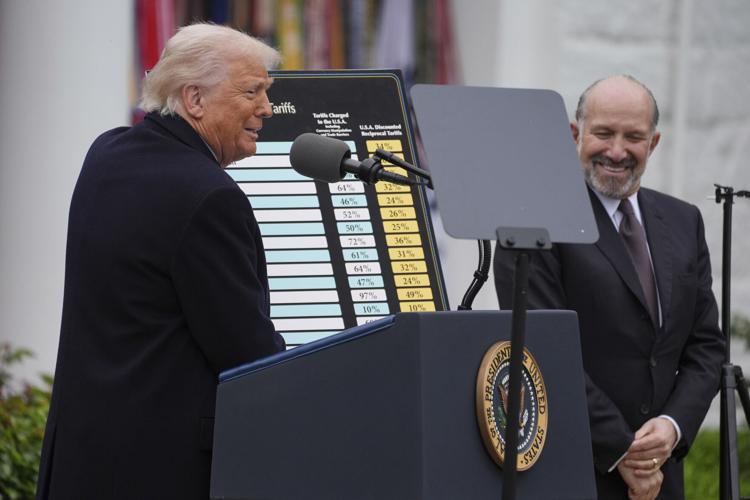
At the heart of former President Donald Trump’s 2025 "Liberation Day" trade policy is a striking claim: Cambodia imposes a 97% tariff on U.S. goods, justifying a retaliatory U.S. tariff of 49%. But this figure is not rooted in reality.
Here’s the math.

Cambodia's 97% Tariff
- The 97% Calculation:
The Trump administration conflated Cambodia’s $12.3 billion trade surplus with the U.S. (2024) and non-tariff barriers (e.g., regulations, taxes) to create an inflated “cheating” metric. In reality, Cambodia’s average tariff on U.S. goods is ~10%, typical for developing Southeast Asian economies. Luxury items like cars face up to 300% tariffs, but these apply globally, not just to the U.S
Other Tariff Claims
-
Sri Lanka: Labeled with an 88% tariff, Sri Lanka faced a 44% U.S. duty. Real tariffs average 12%, but its $3.8 billion trade surplus (tea, rubber) drew scrutiny
-
Bangladesh: A claimed 74% tariff led to a 37% U.S. rate. Actual tariffs are ~13%, yet Bangladesh’s $10 billion apparel exports to the U.S. are now at risk
-
India: Accused of a 52% tariff, India saw a 26% U.S. retaliation. While some sectors (motorcycles, whiskey) face 50–100% Indian tariffs, the average is 6.3%. The U.S. aims to curb India’s $45 billion trade surplus
-
China: The 2018–2020 trade war set precedents. Trump’s 2025 policy cites a 67% Chinese tariff (reciprocal 34%), though actual rates peaked at 25%. China’s $382 billion trade surplus remains a focal point
The U.S. Reciprocal Tariff Formula: USTR’s Official Methodology
According to the USTR’s Reciprocal Tariff Calculations page, the methodology includes:
-
Trade Deficit Weighting:
-
The U.S. divides a nation’s trade surplus with the U.S. by the value of its exports to the U.S., framing the ratio as an effective “tariff.”
-
Example: Cambodia’s 12.5 billion surplus (2024) ÷ 12.5 billion surplus (2024) ÷ 12.7 billion exports = 98.4%, rounded to 97%
-
-
Non-Tariff Barriers (NTBs):
-
NTBs like regulatory hurdles, subsidies, and licensing delays are assigned hypothetical tariff equivalents. For instance, Vietnam’s seafood export inspections were deemed a 15% “tariff” despite no actual duty
-
-
Reciprocal Rate:
-
The final U.S. tariff is set at half the calculated rate (e.g., 97% → 49% for Cambodia)
-
Why This Matters:
The USTR’s approach prioritises reducing trade deficits over traditional tariff analysis. However, it conflates trade imbalances with protectionism, drawing criticism for lacking transparency.
Case Study: Vietnam’s 90% Claim vs. 4.5% Reality
The USTR claims Vietnam imposes a 90% tariff on U.S. goods, justifying a 46% U.S. rate. But WTO data reveals:
- Actual Average Tariff: 4.5% on U.S. imports (2022)
- Duty-Free Access: 40.7% of U.S. non-agricultural exports enter Vietnam tariff-free.
USTR’s Justification: The 90% figure includes:
- Hypothetical NTBs: Delays in tech import approvals (+10%).
- Surplus Penalty: Vietnam’s 136.6 billion trade surplus (2024) ÷ 136.6 billion trade surplus (2024) ÷ 120.99 billion exports = 113%, adjusted to 90%.

ASEAN’s “Dirty 15”: How the USTR Formula Hits Economies
Country |
Claimed Tariff |
U.S. Reciprocal Tariff |
Actual Avg. Tariff |
Key Exports at Risk |
| Cambodia | 97% | 49% | 10% | Garments, solar panels |
| Vietnam | 90% | 46% | 4.5% | Electronics, footwear |
| Thailand | 72% | 36% | 5.8% | Auto parts, rubber |
| Malaysia | 47% | 24% | 4.3% | Semiconductors |
| Indonesia | 64% | 32% | 6.5% | Palm oil, textiles |
Common Thread: All face tariffs inflated by trade deficits and NTBs. For example:
- Thailand’s 72% claim includes its $48 billion surplus and FDA-style food safety rules
- Malaysia’s 47% rate reflects its semiconductor dominance (60% of U.S. chip imports)
Why the Discrepancy? Political Strategy vs. Economic Reality
The Trump administration’s tariff formula includes:
- Trade Deficits: Framing surpluses as “losses” to justify retaliation
- Non-Tariff Barriers: Licensing delays, subsidies, and regulations inflated into tariff equivalents
- Hypotheticals: “What if” scenarios assume worst-case trade practices
Critics Argue:
-
The approach risks global supply chains, as seen during the 2018–2020 China trade war (IMF)

A High-Stakes Bluff
Trump’s reciprocal tariffs rely on mythical numbers to pressure trading partners. While the U.S. aims to shrink deficits, the policy risks alienating allies, destabilising emerging economies, and hurting American consumers. As Cambodia’s garment workers and Vietnamese tech factories brace for impact, the line between trade strategy and political gambit grows ever thinner.
SOURCES:
-
U.S. Trade Representative (USTR), Reciprocal Tariff Calculations
- WTO, ITC and UNCTAD, World Tariff Profile 2024
Let us know what you think about this topic, and what do you want to hear next.
You can now be our community contributor and make a pitch to have your favourite personality be on our show.
Join our community group and drop us your insights on this topic.

-3.png?width=50&name=Square%20(2)-3.png)


.png?width=1200&length=1200&name=reciprocal-tariff-calculations%20(map).png)


Let us know what you think of this post